Insights
Q2 2020 – Highest Cost Natural Gas Producers in North America
Painted Pony Energy Ltd. was one of North America’s highest cost natural gas producers prior to its acquisition by Canadian Natural Resources Ltd. (CNRL) in October, based on fresh data from Evaluate Energy.
This analysis was conducted using Q2 2020 operating and transportation expenses per barrel (“production costs”) for some of the most heavily gas-weighted, publicly listed producers in Canada and the United States.
Click here for a free download of production cost data for all 20 companies in this analysis
In summary:
- All 20 companies produced over 10,000 boe/d in Q2 2020.
- The companies were selected for this natural gas cost analysis because their portfolios were among the more heavily gas-weighted among companies producing at least 10,000 boe/d in Q2 2020. This avoids oil and liquids production skewing the analysis.
- The companies produced in North America only; oilsands producers were excluded.
- U.S. production tax costs are excluded; so, too, are Canadian royalty expenses.
Low cost production is a key indicator that investors will be looking at to help identify healthy gas producing companies in the current climate. For more on the low cost producers of the group, click here.
The most recent production cost data and key conclusions are presented below.

Source: Evaluate Energy
Overall portfolios must be considered
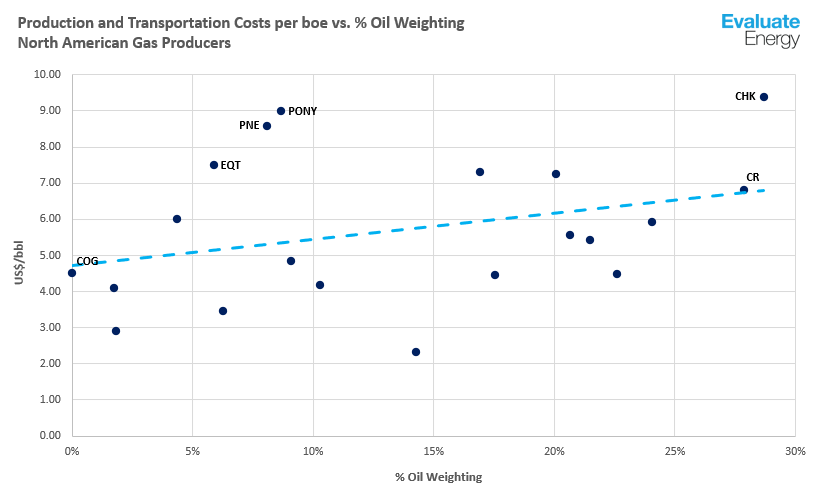
The trend line on the chart, calculated using the production costs of all companies in the group, shows that as oil weighting increases, so does the average cost per barrel of oil equivalent to produce for each company.
Therefore, if one company was producing at $2/boe higher than another this might not make it a “higher cost operator”. It may be because oil makes up a higher proportion of its portfolio.
To illustrate this we examined costs reported both by Cabot Oil & Gas (COG) in the U.S. Appalachian Basin and Crew Energy (CR), a Montney-producer in Canada.
- On the face of it, it appears that Crew is a much higher cost operator at $6.82/boe compared to Cabot’s $4.51/boe.
- In fact, both companies sit almost exactly on the trend line, meaning that Crew’s higher cost per boe can be attributed almost entirely to the higher percentage of liquids in its portfolio.
Examining costs per boe alone can be misleading. When deciding if a company is a producer with high production costs, these metrics must be considered relative to the company’s overall portfolio.
Based on the combined metrics of costs per boe and each company’s oil weighting, we have identified the highest cost producers based on Q2 2020 data.
Highest cost natural gas producers
At around $9.00/boe, Painted Pony Energy Ltd. (PONY) was the highest cost operator relative to its portfolio in Q2 2020. Its costs – almost a full $4.00/boe over the trend line – increased in 2020 after around $2.30/boe related to capital facility fees appeared in its income statement. This relates to certain finance lease obligations in February 2020 now recognized as operating not finance expenses. Canadian Natural Resources finalized its acquisition of Painted Pony in October, stating that Painted Pony’s assets would complement CNRL’s natural gas portfolio in key areas and provide opportunities for cost synergies via pre-built infrastructure and transportation.
Chesapeake Energy (CHK) recorded the highest cost per boe at $9.40, due to high costs associated with its NGL production. Fellow Appalachian Basin producer EQT Corp. (EQT) recorded the cost furthest from the trend line among U.S. gas producers. EQT’s $7.49/boe was around $2.50/boe higher than the trend line’s expected production costs for a company with a portfolio comprised of 6% liquids. EQT’s costs can be attributed to relatively high processing costs compared to other producers in the peer group.
Among the other Canadian companies, Alberta-focused Pine Cliff Energy (PNE) registered the highest cost after Painted Pony’s $9.00/boe at $8.60/boe. Among the costs included in this analysis, Pine Cliff’s highest costs are its operating expenses, which made up 88% of its production costs in Q2.
Click here for a free download of production cost data for all 20 companies in this analysis
Evaluate Energy data allows a comprehensive review of liquidity and company health. Alongside these production cost metrics, data includes debt and interest measures, credit availability figures, hedging portfolios and earnings guidance.